| title | Detailed Explanation of Java Memory Areas (Key Points) | |
|---|---|---|
| category | Java | |
| tag |
|
Unless otherwise specified, this article refers to the HotSpot virtual machine.
This article is a summary based on "Understanding Java Virtual Machine: Advanced Features and Best Practices".
Common interview questions:
- Describe the Java memory areas (runtime data areas).
- The process of creating a Java object (five steps, it is recommended to be able to write them down and understand what the virtual machine does at each step).
- Two ways to access objects (handle and direct pointer).
For Java programmers, under the virtual machine's automatic memory management mechanism, there is no need to write a corresponding delete/free operation for every new operation like C/C++ developers. This significantly reduces the likelihood of memory leaks and memory overflow issues. However, since Java programmers hand over control of memory to the Java virtual machine, when there are issues related to memory leaks and overflows, it will be a daunting task to diagnose the errors if one does not understand how the virtual machine uses memory.
The Java virtual machine divides the memory it manages into several different data areas during the execution of Java programs.
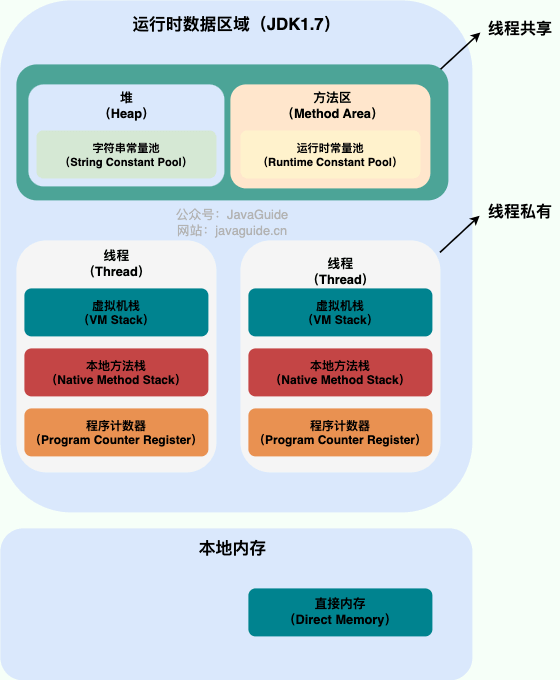
JDK 1.8 differs slightly from previous versions; here we will introduce based on JDK 1.7 and JDK 1.8.
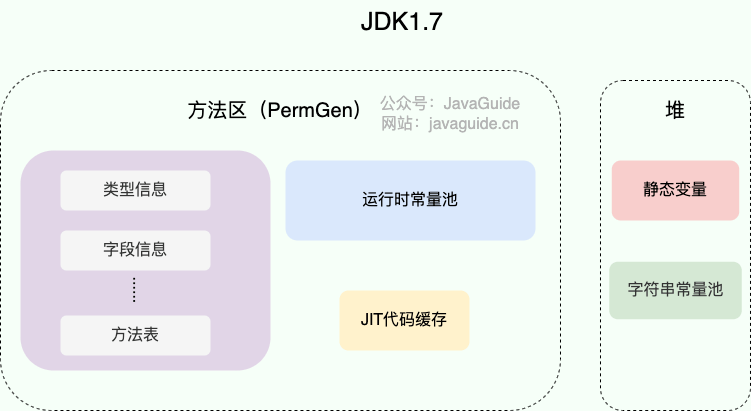
JDK 1.7:
JDK 1.8:
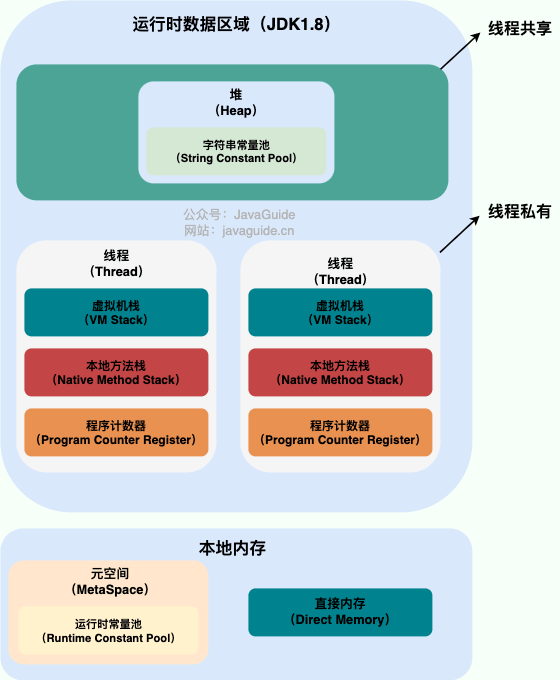
Thread-private:
- Program Counter
- Java Virtual Machine Stack
- Native Method Stack
Thread-shared:
- Heap
- Method Area
- Direct Memory (not part of the runtime data area)
The specification for the Java virtual machine is quite lenient regarding runtime data areas. For example, the heap can be contiguous memory or non-contiguous. The size of the heap can be fixed or expanded dynamically during runtime. Virtual machine implementers can use any garbage collection algorithm to manage the heap, and it is even acceptable not to perform garbage collection at all.
The program counter is a small memory space that can be viewed as a line number indicator of the bytecode currently being executed by the thread. The bytecode interpreter selects the next bytecode instruction to execute by changing the value of this counter; branching, looping, jumping, exception handling, and thread recovery functions all rely on this counter.
In addition, to allow for the correct execution position to be restored after a thread switch, each thread must have an independent program counter that does not affect one another and is stored independently. We refer to this type of memory area as "thread-private".
From the above introduction, we learn that the program counter primarily has two functions:
- The bytecode interpreter uses the program counter to sequentially read instructions, thereby implementing control flow for the code, such as sequential execution, selection, looping, and exception handling.
- In the case of multi-threading, the program counter records the current location of the thread's execution, so when the thread is switched back, it knows where it was last running.
OutOfMemoryError. Its lifecycle is tied to the thread's creation and ends with the thread's termination.
Similar to the program counter, the Java Virtual Machine Stack (hereinafter referred to as "stack") is also thread-private; its lifecycle is the same as that of the thread, created with the thread and destroyed with the thread.
The stack is undoubtedly a core part of the JVM's runtime data area. Except for some Native method calls that are implemented using the native method stack (to be mentioned later), all Java method calls are executed via the stack (and need to coordinate with other runtime data areas like the program counter).
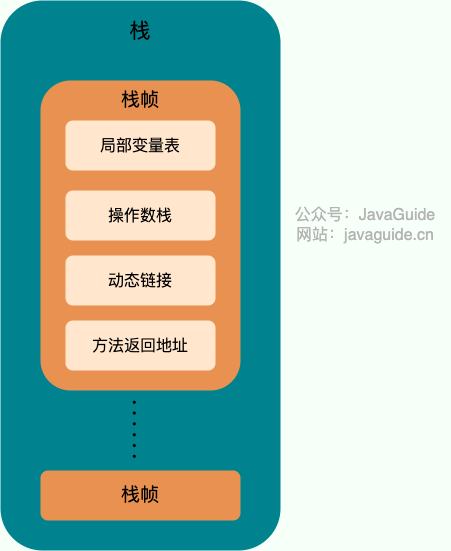
Data needed for method calls is passed through the stack. Every time a method is called, a corresponding stack frame is pushed onto the stack. At the end of each method call, a stack frame is popped off.
The stack consists of a series of stack frames, and each stack frame contains: a local variable table, an operand stack, dynamic linking, and method return addresses. Similar to data structures in the stack, both are last-in-first-out structures that only support push and pop operations.
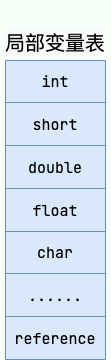
Local Variable Table primarily stores various data types known at compile time (boolean, byte, char, short, int, float, long, double), object references (reference types, which differ from the actual object and may point to the starting address of the object or may refer to a handle or other positions related to the object).
Operand Stack mainly serves as a transfer station for method calls, storing intermediate computation results generated during method execution. Furthermore, temporary variables generated during computations will also be placed in the operand stack.
Dynamic Linking primarily serves scenarios where a method needs to call other methods. The constant pool of the Class file holds numerous symbolic references, such as method references. When a method calls other methods, it needs to convert the symbolic reference pointing to the method in the constant pool into a direct reference in memory. The purpose of dynamic linking is to convert symbolic references into direct references for invoking methods; this process is also known as dynamic connection.

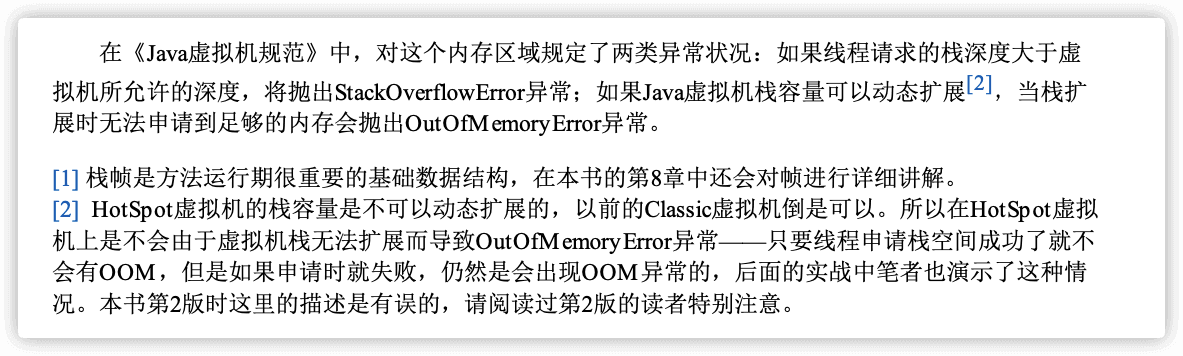
While the stack space is not infinite, it generally does not pose problems under normal calling circumstances. However, if function calls get stuck in an infinite loop, it can lead to too many stack frames being pushed onto the stack, consuming too much space and causing the stack to overflow. When the depth requested by the thread exceeds the maximum depth of the current Java virtual machine stack, it throws StackOverFlowError.
Java methods can return in two ways: one is via the return statement for a normal return, and the other is by throwing an exception. Regardless of the method of return, it will cause the stack frame to be popped off. This means that stack frames are created with method calls and destroyed upon method completion. Regardless of whether the method completes normally or abnormally, it is considered method completion.
Aside from StackOverFlowError, stacks can also experience OutOfMemoryError; this occurs if the memory size of the stack can be dynamically expanded, but when the virtual machine cannot allocate enough memory during dynamic stack expansion, it throws an OutOfMemoryError.
To summarize, the stack can encounter two errors during program execution:
StackOverFlowError: If the memory size of the stack does not allow for dynamic expansion, when the depth requested by the thread exceeds the maximum depth of the current Java virtual machine stack, it throwsStackOverFlowError.OutOfMemoryError: If the memory size of the stack can be dynamically expanded, when the virtual machine cannot allocate enough memory during dynamic stack expansion, it throws anOutOfMemoryError.
The native method stack serves a role very similar to the virtual machine stack, but the distinction is: the virtual machine stack serves Java methods executed by the virtual machine (i.e., bytecode), while the native method stack serves Native methods used by the virtual machine. In the HotSpot virtual machine, the two stacks are combined.
When a native method is executed, a stack frame will also be created in the native method stack to store the local variable table, operand stack, dynamic linking, and exit information for that native method.
After the method execution completes, the corresponding stack frame will also pop off and release memory, and StackOverFlowError and OutOfMemoryError can occur as well.
The largest area of memory managed by the Java virtual machine, the Java heap is a shared memory area among all threads, created when the virtual machine starts. The sole purpose of this memory area is to store object instances; almost all object instances and arrays are allocated memory here.
In the world of Java, "almost" all objects are allocated in the heap, but with the development of JIT compilers and the maturity of escape analysis techniques, stack allocation and scalar replacement optimization techniques will lead to some subtle changes; it is becoming less "absolute" that all objects are allocated to the heap. From JDK 1.7 onwards, escape analysis is enabled by default. If object references in certain methods are not returned or not used outside (i.e., do not escape), then the object can be allocated memory directly on the stack.
The Java heap is the main area managed by the garbage collector, so it is also known as the GC Heap (Garbage Collected Heap). From a garbage collection perspective, since current collectors mostly use generational garbage collection algorithms, the Java heap can further be divided into: Young Generation and Old Generation; it can be detailed further into: Eden, Survivor, and Old spaces. The purpose of further division is to better reclaim memory or allocate it faster.
In JDK 7 and earlier versions, heap memory was typically divided into three parts:
- Young Generation Memory
- Old Generation
- Permanent Generation
The Eden area and two Survivor areas (S0 and S1) shown in the figure below all belong to the Young Generation, with the middle layer belonging to the Old Generation, and the bottom layer belonging to the Permanent Generation.
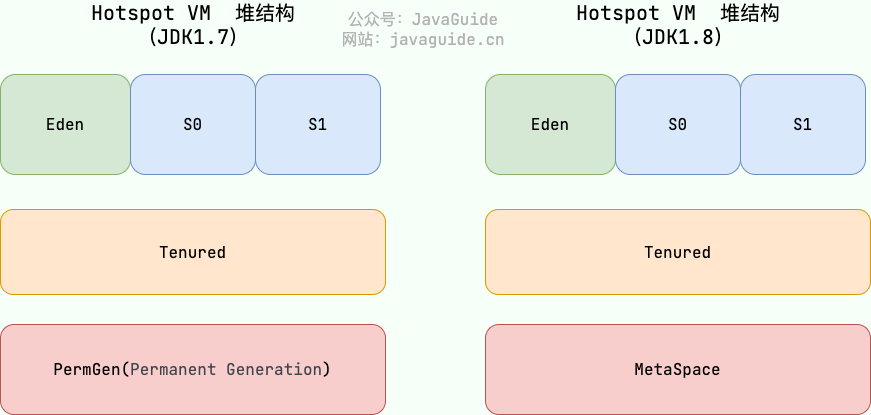
After JDK 8, PermGen (Permanent Generation) has been replaced by Metaspace. (I will detail this in the method area section).
In most cases, objects will first be allocated in the Eden area. After a Young Generation garbage collection, if the objects are still alive, they will enter S0 or S1, and the age of the objects will increase (the initial age of objects that move from the Eden area to the Survivor area becomes 1). When their age increases to a certain extent (default is 15 years), they will be promoted to the Old Generation. The age threshold for object promotion to the Old Generation can be set via the -XX:MaxTenuringThreshold parameter. However, the set value should be between 0 and 15; otherwise, the following error will be thrown:
MaxTenuringThreshold of 20 is invalid; must be between 0 and 15Why is the age restricted to 0-15?
Because the area that records the age in the object header usually has a size of 4 bits. The maximum binary number that can be represented by these 4 bits is 1111, which is decimal 15. Therefore, the age of an object is restricted between 0 and 15.
Here we will briefly introduce the object layout in detail.
In the HotSpot virtual machine, the storage layout of an object in memory can be divided into three areas: object header (Header), instance data (Instance Data), and alignment padding (Padding). The object header comprises two parts: the mark field (Mark Word) and the type pointer (Klass Word). A detailed introduction of the object memory layout will be provided later, so I won't repeat it here.
This age information is stored in the mark field (which also stores other object-related information such as hash code, lock status, etc.). The structure of the mark word is defined in markOop.hpp:
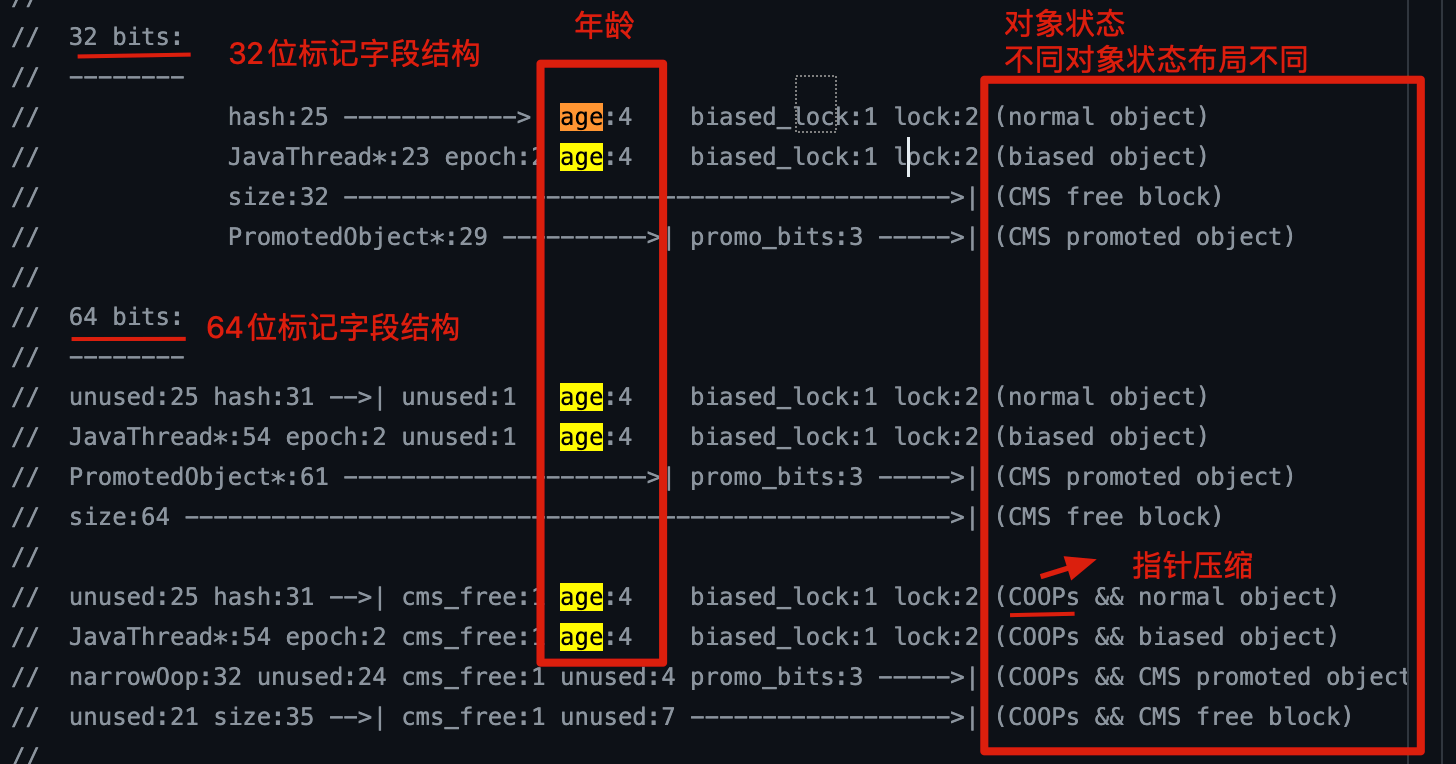
It can be seen that the age of the object occupies a size of 4 bits.
🐛 Correction (see: issue552): “When Hotspot traverses all objects, it accumulates sizes occupied by them in ascending order of age. When the accumulated size exceeds half of the Survivor area at a certain age, it takes the smaller value between this age and
MaxTenuringThresholdas the new promotion age threshold.”The code for dynamic age calculation is as follows
uint ageTable::compute_tenuring_threshold(size_t survivor_capacity) {
 //survivor_capacity是survivor空间的大小
size_t desired_survivor_size = (size_t)((((double) survivor_capacity)*TargetSurvivorRatio)/100);//TargetSurvivorRatio 为50
size_t total = 0;
uint age = 1;
while (age < table_size) {
total += sizes[age];//sizes数组是每个年龄段对象大小
if (total > desired_survivor_size) break;
age++;
}
uint result = age < MaxTenuringThreshold ? age : MaxTenuringThreshold;
  ...
}
The most common error that occurs on the heap is OutOfMemoryError, and there are several manifestations of this error:
java.lang.OutOfMemoryError: GC Overhead Limit Exceeded: This error occurs when the JVM spends too much time performing garbage collection while recovering very little heap space.java.lang.OutOfMemoryError: Java heap space: If there is insufficient room in the heap memory to accommodate new objects during their creation, this error is thrown. (This is related to the configured maximum heap memory, subject to physical memory size. Maximum heap memory can be configured using the-Xmxparameter; if no special configuration is made, the default value will be used. See: Default Java 8 max heap size).- …
The method area is a logical area of the JVM's runtime data area that is shared across all threads.
The "Java Virtual Machine Specification" merely states that there is a concept of a method area and its functions; the actual implementation of the method area depends on the virtual machine. In other words, the implementations of the method area differ across various virtual machine implementations.
When the virtual machine needs to use a class, it reads and parses the Class file to retrieve the relevant information, which is then stored in the method area. The method area holds data such as the class information, field information, method information, constants, static variables, and code cache for just-in-time compiler-compiled methods.
What is the relationship between the method area, permanent generation, and metaspace? The relationship between the method area, permanent generation, and metaspace is reminiscent of the relationship between interfaces and classes in Java. A class implements an interface, where the class can be seen as the permanent generation and metaspace, while the interface can be viewed as the method area. Thus, the permanent generation and metaspace are two different implementations of the method area according to the HotSpot virtual machine's interpretation of the virtual machine specification, with the permanent generation being the implementation prior to JDK 1.8 and the method area implemented as metaspace from JDK 1.8 onward.

Why replace PermGen (Permanent Generation) with Metaspace?
The following diagram comes from "Understanding Java Virtual Machine" 3rd Edition 2.2.5:

- The entire permanent generation has a fixed size limit set by the JVM itself, which cannot be adjusted (subject to JVM memory constraints), while metaspace uses native memory, which is constrained by the available memory of the machine. Although metaspace can still overflow, the chances are lower than before.
When metaspace overflows, the following error occurs:
java.lang.OutOfMemoryError: MetaSpaceYou can set the maximum metaspace size using the
-XX:MaxMetaspaceSizeflag, with the default value being unlimited, meaning it is only constrained by system memory. The-XX:MetaspaceSizeparameter adjusts the initial size of metaspace; if not specified, metaspace will dynamically resize according to the application's runtime demands.
-
The metaspace holds the metadata of classes; thus, the number of class metadata loaded is no longer controlled by
MaxPermSizebut by system's actual available space, allowing more classes to be loaded. -
In JDK8, when merging the code from HotSpot and JRockit, JRockit never had something called permanent generation; thus, after the merge, there was no need to have an additional permanent generation area.
-
The permanent generation adds unnecessary complexity to GC and has relatively low recovery efficiency.
What are commonly used parameters for the method area?
Before JDK 1.8, when the permanent generation had not yet been fully removed, these parameters were generally used to adjust the size of the method area.
-XX:PermSize=N // Initial size of the method area (Permanent Generation)
-XX:MaxPermSize=N // Maximum size of the method area (Permanent Generation), exceeding this value will throw OutOfMemoryError exception: java.lang.OutOfMemoryError: PermGen
In general, garbage collection behavior tends to be less frequent in this area, but data does not exist indefinitely in the method area after it is entered.
In JDK 1.8, the method area (permanent generation in HotSpot) was completely removed (it had already begun in JDK 1.7), replaced by metaspace, which uses native memory. The following are some commonly used parameters:
-XX:MetaspaceSize=N // Sets the initial (and minimum) size of Metaspace
-XX:MaxMetaspaceSize=N // Sets the maximum size of Metaspace
One significant difference from the permanent generation is that if no size is specified, the virtual machine will exhaust all available system memory as more classes are created.
In addition to information about class versions, fields, methods, interfaces, etc., the Class file also contains a Constant Pool Table, which stores various literals (Literal) and symbolic references (Symbolic Reference) generated during compile time.
Literals are representations of fixed values in source code; we can understand their meaning through their literals. Literals include integers, floating-point numbers, and string literals. Common symbolic references include class symbolic references, field symbolic references, method symbolic references, and interface method symbols.
Section 7.34 of "Understanding Java Virtual Machine" 3rd Edition provides the following explanation of symbolic references and direct references:
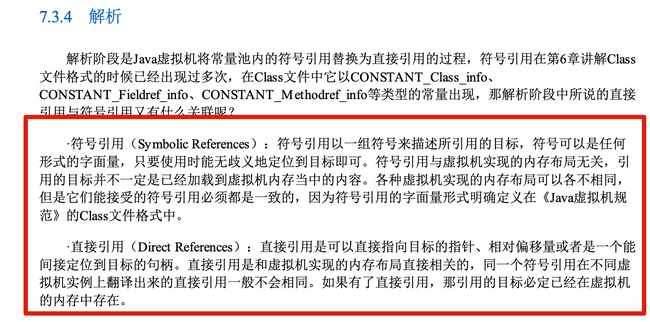
The constant pool table will be stored in the runtime constant pool of the method area after class loading.
The functionality of the runtime constant pool is similar to that of a traditional programming language's symbol table, although it holds a wider range of data than the typical symbol table.
Since the runtime constant pool is part of the method area, it is naturally subject to the memory limitations of the method area. When the constant pool can no longer request memory, it will throw an OutOfMemoryError.
The String Constant Pool is a special area allocated by the JVM to enhance performance and reduce memory consumption for strings (String class), primarily to avoid redundant string creation.
// Create a string object "ab" in the String Constant Pool
// Assign the reference of the string object "ab" to aa
String aa = "ab";
// Directly return the string object "ab" from the String Constant Pool, assigning it to reference bb
String bb = "ab";
System.out.println(aa==bb); // true
The implementation of the string constant pool in the HotSpot virtual machine is defined in src/hotspot/share/classfile/stringTable.cpp. The StringTable can be simply understood as a fixed-size HashTable, with a capacity of StringTableSize (which can be set via the -XX:StringTableSize parameter), storing the mapping of strings (key) to references of string objects (value) that point to string objects in the heap.
Before JDK 1.7, the string constant pool was located in the permanent generation. In JDK 1.7, the string constant pool and static variables moved from the permanent generation to the Java heap.

Why did JDK 1.7 move the string constant pool to the heap?
The primary reason is that the GC recovery efficiency of the permanent generation (method area implementation) is too low, only being executed during full heap collections (Full GC). Since a Java program often generates a large number of strings waiting for garbage collection, moving the string constant pool to the heap enables more efficient and timely recovery of string memory.
Related question: Does the JVM constant pool store objects or references? - RednaxelaFX - Zhihu
Lastly, I want to share a statement from Professor Zhou Zhimin mentioned in the sample code and errata of "Understanding Java Virtual Machine (3rd Edition)" GitHub repository issue #112:
The runtime constant pool, method area, and string constant pool are logical concepts that do not change with virtual machine implementations; they are public and abstract, while metaspace and heap are physical concepts related to specific virtual machine implementations and are private and concrete.
Direct memory is a special memory buffer that is not allocated in the Java heap or method area, but rather allocated in native memory via JNI.
Direct memory is not part of the virtual machine's runtime data area and is not defined as a memory area in the virtual machine specification; however, this memory is frequently used. It may also lead to the appearance of OutOfMemoryError.
In JDK1.4, the introduction of NIO (Non-Blocking I/O, also known as New I/O) introduced an I/O mode based on channels (Channel) and buffers (Buffer) that allows direct allocation of off-heap memory using native function libraries, and operations are conducted via a DirectByteBuffer object stored in the Java heap as a reference to that memory. This can significantly improve performance in some scenarios because it avoids duplicate data copying between the Java heap and the native heap.
Allocation of direct memory is not constrained by the Java heap, but as it is still memory, it is subject to the limits of the total memory size of the machine and the processor's addressing space.
A similar concept is off-heap memory. In some articles, direct memory is equated with off-heap memory; however, I find this comparison somewhat inaccurate.
Off-heap memory is where memory objects are allocated in memory outside the heap, and this memory is directly managed by the operating system (rather than the virtual machine), which results in a reduction of the impact of garbage collection on the application.
From the previous description, we have a general understanding of memory in the virtual machine. Next, let's take a closer look at the entire process of object allocation, layout, and access in the Java heap of the HotSpot virtual machine.
I suggest memorizing the process of creating Java objects and understanding what happens at each step.
When the virtual machine encounters a new instruction, it first checks whether the parameters of this instruction can locate the symbolic reference of the class in the constant pool and whether the class represented by this symbolic reference has been loaded, resolved, and initialized. If not, the corresponding class loading process must occur.
After the class loading check passes, the virtual machine will allocate memory for the new object. The required memory size for the object can be determined after the class loading is complete; allocating space for the object is akin to partitioning a block of fixed-size memory from the Java heap. The allocation methods are “pointer collision” and “free list”, with which method to choose determined by whether the Java heap is tidy, and whether the garbage collector employed provides compression and organization functions.
Two methods of memory allocation (supplementary content to master):
- Pointer Collision:
- Applicable scenario: When heap memory is tidy (i.e., there is no memory fragmentation).
- Principle: Used memory is consolidated to one side, and unused memory is on the other side. There is a boundary pointer in between; the pointer is moved toward the direction of the unused memory, corresponding to the object memory size.
- GC collectors using this allocation method: Serial, ParNew
- Free List:
- Applicable scenario: When heap memory is not tidy.
- Principle: The virtual machine maintains a list recording which memory blocks are available, and when allocating, it finds a sufficiently large memory block to partition for the object instance, then updates the list records.
- GC collectors using this allocation method: CMS
Which of the above methods is chosen depends on whether the Java heap memory is tidy. The tidiness of Java heap memory depends on whether the GC collector's algorithm is "mark-sweep" or "mark-compact", and it’s worth noting that memory allocated by the copy algorithm is also tidy.
Concurrency Issues in Memory Allocation (supplementary content to master)
A significant issue when creating objects is thread safety, because in actual development, object creation is very frequent; as such, the virtual machine must ensure thread safety. Generally speaking, the virtual machine employs two methods to ensure thread safety:
- CAS + retry on failure: CAS is an implementation of optimistic locking, where no lock is applied, and it is assumed that there are no conflicts during an operation. If a conflict occurs, a retry happens until success. The virtual machine uses the combination of CAS and failure retry to ensure atomicity in update operations.
- TLAB: Each thread is pre-allocated a block of memory in the Eden area. When the JVM allocates memory for objects in the thread, it first allocates from TLAB. When an object exceeds the remaining memory in TLAB or if TLAB's memory is exhausted, the aforementioned CAS method is used for memory allocation.
After memory allocation is complete, the virtual machine needs to initialize the allocated memory space to zero values (excluding the object header). This ensures that the instance fields of the object can be used directly in Java code without explicit initialization, allowing the program to access field data types corresponding to the zero values.
Once zero initialization is complete, the virtual machine performs necessary settings on the object, such as identifying which class the object instance belongs to, how to find the class metadata information, the object's hash code, and the object’s generation age for GC, etc. This information is stored in the object header. Furthermore, based on the current operational state of the virtual machine, such as whether biased locks are enabled, there will be different settings for the object header.
After the above steps are completed, from the perspective of the virtual machine, a new object has been created, but from the view of the Java program, the object creation is just beginning; the <init> method has not yet executed, and all fields are still zero. Therefore, generally speaking, after executing the new instruction, the <init> method will be executed next to initialize the object according to the programmer's intentions, marking the object as fully produced and ready for use.
In Hotspot virtual machines, the memory layout of an object can be divided into three areas: object header (Header), instance data (Instance Data), and alignment padding (Padding).
The object header contains two types of information:
- Mark Field (Mark Word): used to store the runtime data of the object itself, such as hash code (HashCode), GC generation age, lock state flags, threads that hold locks, biased thread ID, and timestamp, etc.
- Type Pointer (Klass pointer): a pointer that indicates the metadata of the class corresponding to the object. The virtual machine uses this pointer to determine which class the object instance belongs to.
The instance data part is where the effective information of the object is really stored, reflecting the fields defined in the program of various types.
The alignment padding part is not necessarily present and has no particular meaning, merely serving as a placeholder. Because the automatic memory management system of the Hotspot JVM requires the starting address of the object to be a multiple of 8 bytes; in other words, the size of the object must also be a multiple of 8 bytes. The object header part is conveniently a multiple of 8 bytes (1 time or 2 times), so when the object instance data part is not aligned, alignment padding is required to fill out the differences.
Creating objects allows us to use them; our Java programs manipulate actual objects on the heap using reference data on the stack. The method of accessing objects is determined by the implementation in the virtual machine, with current mainstream access methods being: using handles and direct pointers.
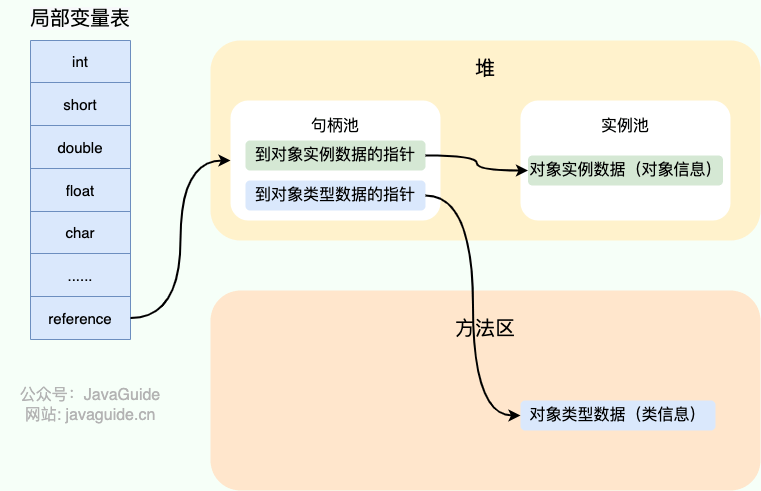
If using handles, a memory area will be split off in the Java heap to serve as a handle pool, with references storing the address of the object handle, and the handle itself containing address information for both the instance data and type data of the object.
If accessing via direct pointer, the reference simply stores the direct address of the object.
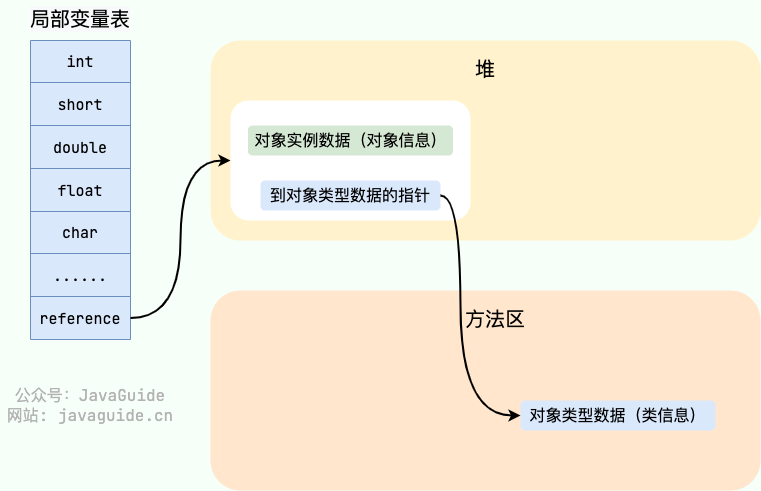
Each of these object access methods has its advantages. The main benefit of accessing via handle is that the reference stores a stable handle address; when the object moves, only the instance data pointer within the handle will change, while the reference itself does not need to be altered. The greatest advantage of accessing via direct pointer is speed, as it saves the overhead of an additional pointer location.
The HotSpot virtual machine primarily uses this method for object access.
- "Understanding Java Virtual Machine: Advanced Features and Best Practices (2nd Edition)"
- "Write Your Own Java Virtual Machine"
- Chapter 2. The Structure of the Java Virtual Machine: https://docs.oracle.com/javase/specs/jvms/se8/html/jvms-2.html
- Internal Structure of JVM Stack Frame - Dynamic Linking: https://chenxitag.com/archives/368
- When does "new String("literal")" store the "literal" in String Constant Pool? - Mu Girl's Answer - Zhihu: https://www.zhihu.com/question/55994121/answer/147296098
- Does the JVM constant pool store objects or references? - RednaxelaFX's Answer - Zhihu: https://www.zhihu.com/question/57109429/answer/151717241
- http://www.pointsoftware.ch/en/under-the-hood-runtime-data-areas-javas-memory-model/
- https://dzone.com/articles/jvm-permgen-%E2%80%93-where-art-thou
- https://stackoverflow.com/questions/9095748/method-area-and-permgen